96 lines
3.2 KiB
Markdown
96 lines
3.2 KiB
Markdown
go-chart
|
|
========
|
|
[](https://circleci.com/gh/wcharczuk/go-chart) [](https://goreportcard.com/report/github.com/wcharczuk/go-chart)
|
|
|
|
Package `chart` is a very simple golang native charting library that supports timeseries and continuous line charts.
|
|
|
|
Master should now be on the v3.x codebase, which overhauls the api significantly. Per usual, see `examples` for more information.
|
|
|
|
# Installation
|
|
|
|
To install `chart` run the following:
|
|
|
|
```bash
|
|
> go get -u github.com/wcharczuk/go-chart
|
|
```
|
|
|
|
Most of the components are interchangeable so feel free to crib whatever you want.
|
|
|
|
# Output Examples
|
|
|
|
Spark Lines:
|
|
|
|

|
|
|
|
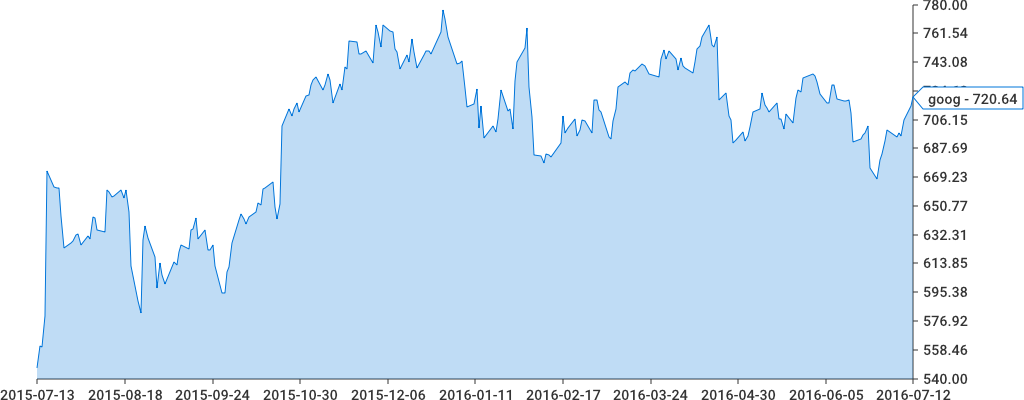
Single axis:
|
|
|
|
|
|
|
|
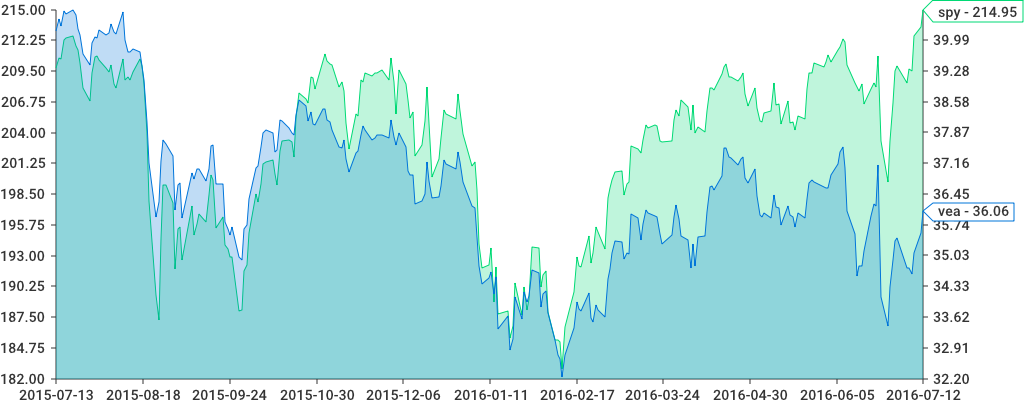
Two axis:
|
|
|
|
|
|
|
|
# Other Chart Types
|
|
|
|
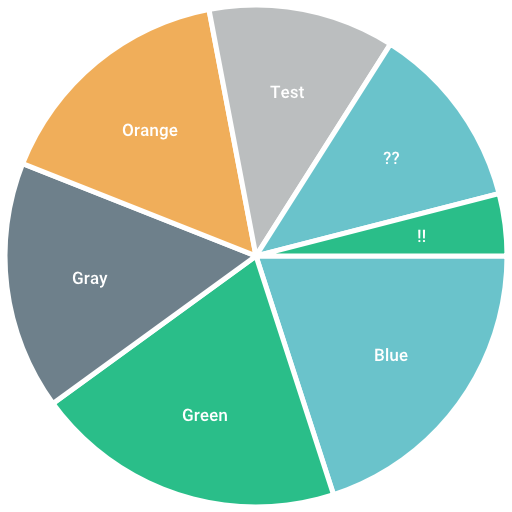
Pie Chart:
|
|
|
|
|
|
|
|
The code for this chart can be found in `examples/pie_chart/main.go`.
|
|
|
|
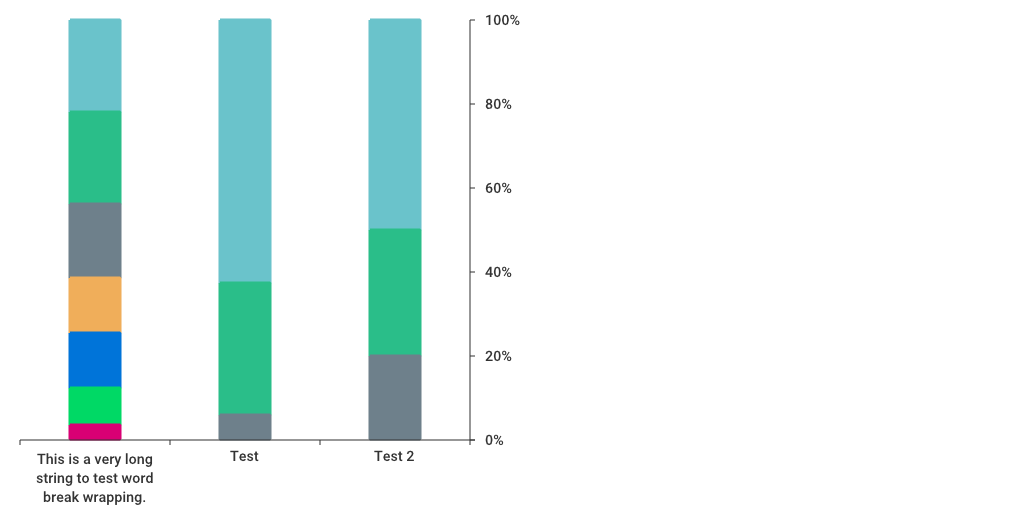
Stacked Bar:
|
|
|
|
|
|
|
|
The code for this chart can be found in `examples/stacked_bar/main.go`.
|
|
|
|
# Code Examples
|
|
|
|
Actual chart configurations and examples can be found in the `./examples/` directory. They are simple CLI programs that write to `output.png` (they are also updated with `go generate`.
|
|
|
|
# Usage
|
|
|
|
Everything starts with the `chart.Chart` object. The bare minimum to draw a chart would be the following:
|
|
|
|
```golang
|
|
|
|
import (
|
|
...
|
|
"bytes"
|
|
...
|
|
"github.com/wcharczuk/go-chart" //exposes "chart"
|
|
)
|
|
|
|
graph := chart.Chart{
|
|
Series: []chart.Series{
|
|
chart.ContinuousSeries{
|
|
XValues: []float64{1.0, 2.0, 3.0, 4.0},
|
|
YValues: []float64{1.0, 2.0, 3.0, 4.0},
|
|
},
|
|
},
|
|
}
|
|
|
|
buffer := bytes.NewBuffer([]byte{})
|
|
err := graph.Render(chart.PNG, buffer)
|
|
```
|
|
|
|
Explanation of the above: A `chart` can have many `Series`, a `Series` is a collection of things that need to be drawn according to the X range and the Y range(s).
|
|
|
|
Here, we have a single series with x range values as float64s, rendered to a PNG. Note; we can pass any type of `io.Writer` into `Render(...)`, meaning that we can render the chart to a file or a resonse or anything else that implements `io.Writer`.
|
|
|
|
# API Overview
|
|
|
|
Everything on the `chart.Chart` object has defaults that can be overriden. Whenever a developer sets a property on the chart object, it is to be assumed that value will be used instead of the default.
|
|
|
|
The best way to see the api in action is to look at the examples in the `./_examples/` directory.
|
|
|
|
# Design Philosophy
|
|
|
|
I wanted to make a charting library that used only native golang, that could be stood up on a server (i.e. it had built in fonts).
|
|
|
|
The goal with the API itself is to have the "zero value be useful", and to require the user to not code more than they absolutely needed.
|
|
|
|
# Contributions
|
|
|
|
Contributions are welcome though this library is in a holding pattern for the forseable future.
|